Slack: Very Attractive Unit Economics But With a Very Long Payback Period
Second part of our analysis that converts unit economics insights into an overall fair valuation estimate is published here.
On April 26, Slack filed its Form S-1 with the SEC to become a publicly traded company. It is one of many high-profile listings we have seen so far in 2019, including Lyft, Uber, and Zoom. Like many of these earlier IPO firms, Slack revealed strong revenue growth (80-100% year-on-year) and large losses (e.g., an operating loss of ~40% of revenues in the most recent period). As a result, many have been wondering whether there is a path to profitability in future years and, if so, whether that path is short enough to justify a healthy valuation. While the IPO (or, technically, DPO or Direct Public Offering since the firm is listing its shares directly) has not been priced yet, Slack raised at a $7B valuation last August and more recent private market transactions value the firm at nearly $17B. Both of these figures far exceed the ~$500M revenue run rate Slack generated last quarter.
To help shed some light on Slack’s path to profitability, we use our Customer-Based Corporate Valuation (CBCV) methodology, which we have successfully applied many times to public and private companies alike, to see what it implies for Slack’s unit economics. As Slack is a subscription-based firm, we used an extension of the methodology from our Journal of Marketing paper, which laid out the basic CBCV framework for such firms.
This example is a bit different from the public company analyses we have done in the past in that Slack is a B2B firm, while our previous analyses have all been for B2C firms. As we will see however, the model continues to validate as well as ever – we just see larger values for both CAC and post-acquisition customer valuations. Regardless of whether we are analyzing a B2B firm or a B2C firm, our core underlying approach is exactly the same: we analyze how much a company spends to acquire customers, how much revenue the firm will get from those customers until they churn, and how much of those revenues will flow through into variable profits. At its heart, CBCV is nothing more than a simple yet broadly applicable accounting identity.
Cutting to the chase, this is a summary of our main findings:
- (+) Strong customer retention. The model infers that only ~10% of newly acquired paid customers churn in the first year after acquisition, and that 80% of paid customers will still be paying 5 years later. This strong retention profile implies that acquired customers have extremely long lifetimes and can be thought of as annuity-like once they have been acquired.
- (+) Healthy marketing ROI. On average, newly acquired customers generate $99,000 in CLV, netting $107,000 in post-acquisition value (PAV) per customer against ~$7,700 spent on CAC, resulting in a strong 1,200%+ marketing ROI. Even though CAC rose sharply in FY2019, this is not problematic because CAC remains much smaller than PAV. On the contrary, increased marketing spend has enabled Slack to accelerate its growth in a profitable way.
- (-) Long payback period. We estimate that the average payback period for a newly acquired customer is about three years, implying a very back-end-loaded payment profile that makes Slack more sensitive to long-term customer retention (and other possible customer dynamics) than other firms we have analyzed. It also implies that Slack may incur large losses as it builds its subscriber base, which makes Slack’s path to profitability a long-term game.
- (+/-) Extreme customer heterogeneity. Variability across customers’ CLVs is high, mostly due to considerable variation in ARPU across paid customers. Slack’s top 1% of customers (by value) have an average PAV of ~$4.9M while the other 99% have an average PAV of only $56K. The top 1% accounts for almost 50% of total value of Slack’s current customer base. Slack may be losing money on up to 75% of its newly acquired paid customers, but the remaining 25% more than make up for it. This has positive and negative implications for the business. On one hand, it implies that Slack’s valuation is entirely dependent upon continuing to find a relatively small group of “whales” in future years, raising questions about the TAM for whales; on the other, it creates customer-centric opportunities that would otherwise not have been possible. Furthermore, the count of these heavy customers has grown consistently over time and monetization has been relatively consistent across acquisition cohorts, implying less risk than may seem to exist at first glance.
These results suggest a healthy view of Slack’s unit economics to date. Very few companies can claim a 1,000%+ return on their marketing investment (Lyft’s marketing ROI was ~60%!). We will examine how this flows through into overall valuation after taking into account future customer acquisitions, fixed costs, and other factors in a follow up post.
Next, we will summarize the available data, then specify and validate our model for the firm. We will subsequently discuss in detail and expand upon the conclusions summarized above.
The Data
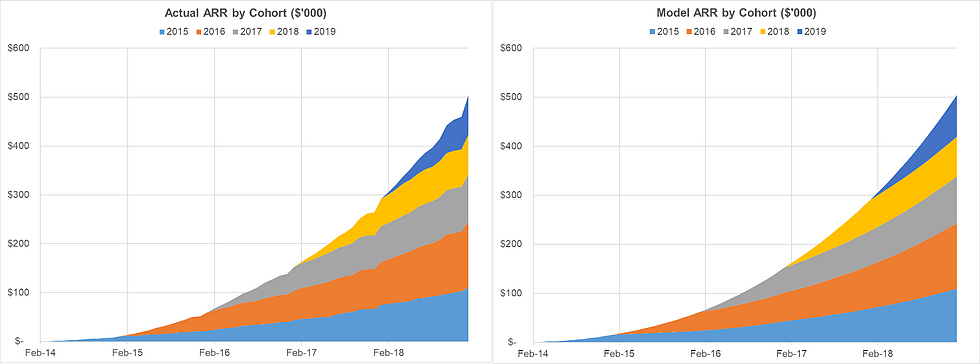
As we’ve said many times, the customer cohort chart (“C3”) is one of the richest and most insightful sources of aggregate customer information that investors can find in public presentations. This disclosure, together with a few pieces of other customer information, enables investors to use a CBCV approach to infer virtually all they might want to know about company’s unit economics – CLV, CAC, customer base and revenue forecasts, etc. Fortunately for us, Slack disclosed its C3 on p. 68 of the S-1, showing strong expansion of the annual recurring revenue (ARR) for each cohort over time:
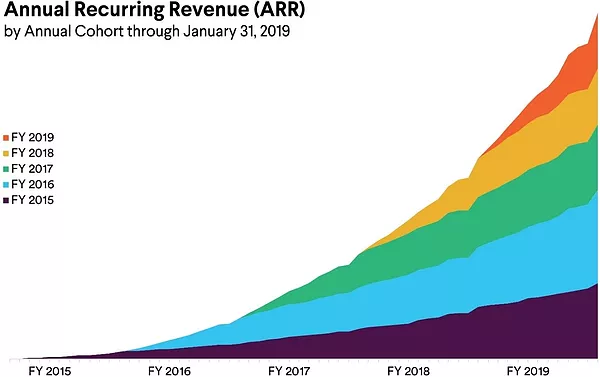
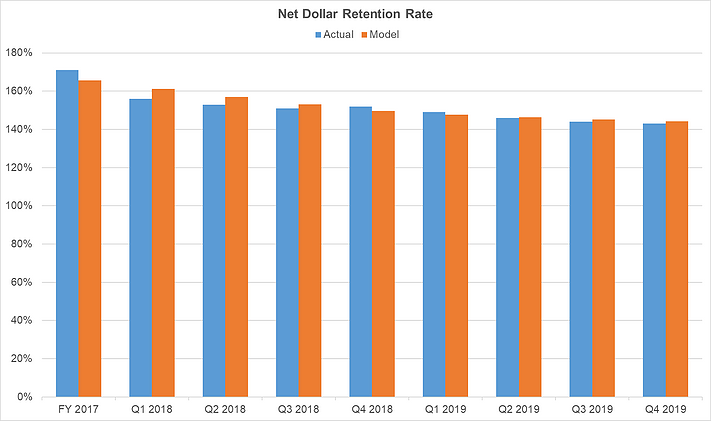
The only thing that could have made this chart even more insightful would be if Slack had analogously disclosed its paying customer counts for each cohort over time. The Net Dollar Retention Rate, which Slack also discloses in its S-1, is interesting but conflates two separate processes – customer churn and revenue expansion. Revenue from a cohort may grow from $100 in one year to $140 in the next because no customers churned and ARPU grew 40%, or because 50% of customers churned and for the remaining 50%, ARPU grew 180%. The inferences that we would draw about the risks of the business would be dramatically different in these two states of the world. Separating out churn from ARPU is important because it allows investors to more accurately estimate a company’s customer acquisition cost (CAC) and evaluate its dependency on future customer acquisitions. Having said that, Slack disclosed just enough other customer-related data points to allow us to pin down customer churn and separate it from revenue expansion.
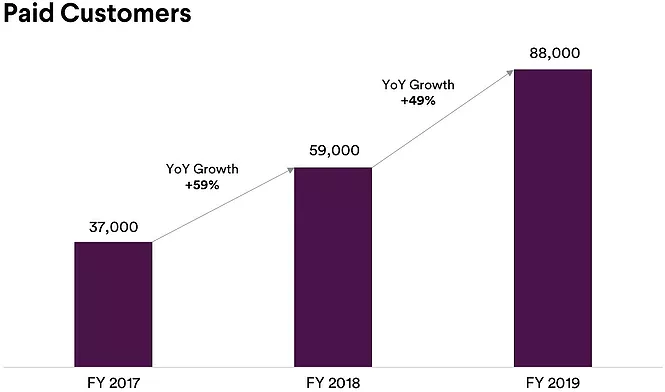
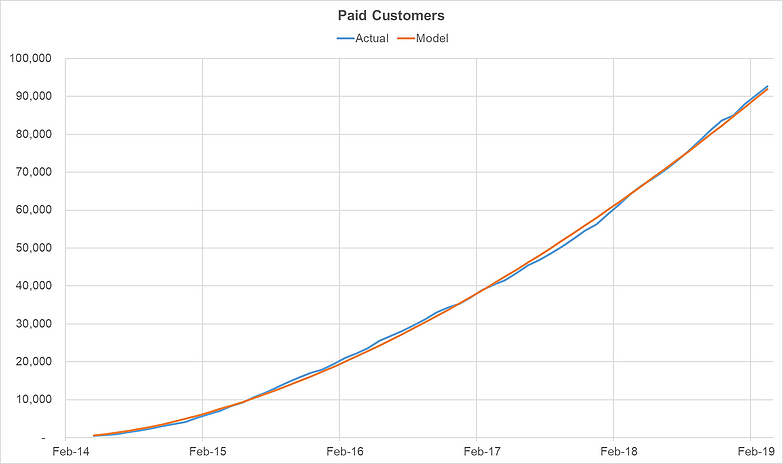
In addition to the C3 and financial information, Slack disclosed a number of additional customer metrics, some quite standard and others not so much. One of the more common metrics is Slack’s number of paid customers:
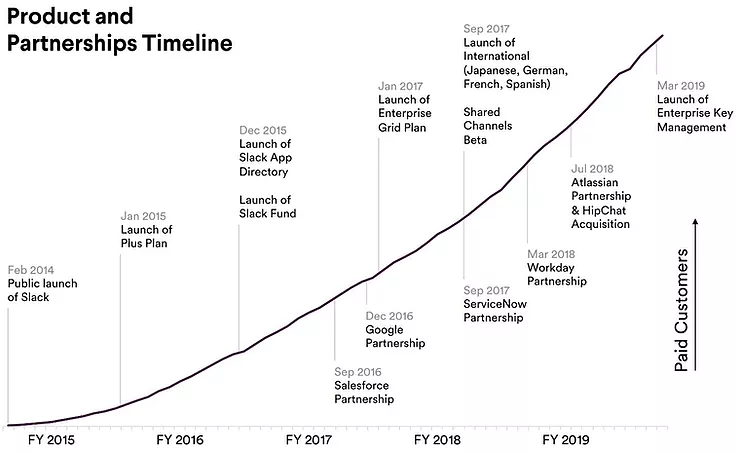
The Paid Customers chart above, together with the more granular customer information Slack provided in the Product and Partnerships Timeline below (using pixel-measuring software), allowed us to estimate the customer base size on a monthly basis since Slack began commercial operations:
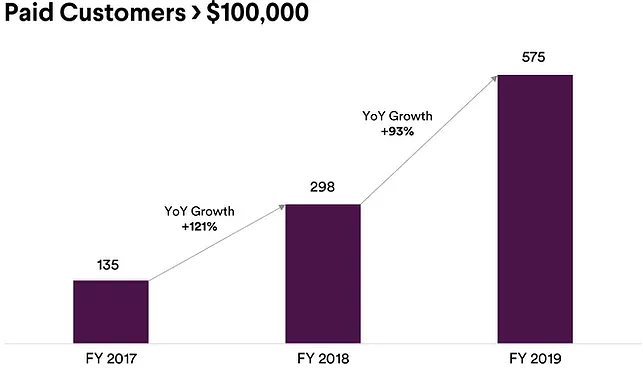
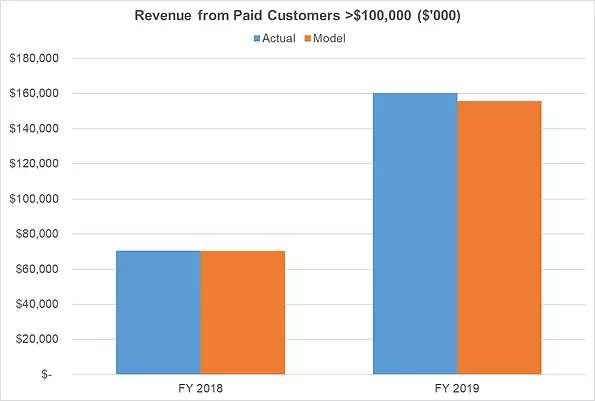
Slack also disclosed how many “heavy” customers (i.e., customers with ARR greater than $100,000) it has along with the share of revenue generated by those heavy customers (22%, 32%, and 40% in the FY 2017, 2018, and 2019). These disclosures provide us insight into the variability of customer spending across the customer base, which we incorporate into our statistical model for customer spending.
These charts suggest positive top-line dynamics, but as always, the real question is what all of this implies for the four main CBCV drivers for subscription-based firms: (1) how many customers is Slack acquiring and at what cost, (2) how long are customers staying active after they have been acquired, (3) how much they spend while they are active, and (4) how much of that spend trickles down into variable profitability. The model we lay out below will provide insights into all of these dimensions.
The Model
The modeling framework we use is largely similar to the one we used to analyze Blue Apron, building on the more formal methodology laid out in our paper valuing subscription businesses. We apply statistical models to three customer processes cohort by cohort: (1) acquisition, i.e., when an organization becomes a paying customer, (2) retention, allowing for heterogeneity in customer churn propensities, and (3) spend while active, also allowing for heterogeneity in customer spend across the customer base.
Even though Slack didn’t disclose its gross customer acquisition data (which the original model uses to model the inflow of customers), we generalized the model estimation procedure so that we could calibrate the model upon all of the aforementioned customer-related data in addition to Slack’s traditional financial data. As you can see below, the resulting model estimates align nicely with each of the observed disclosures:
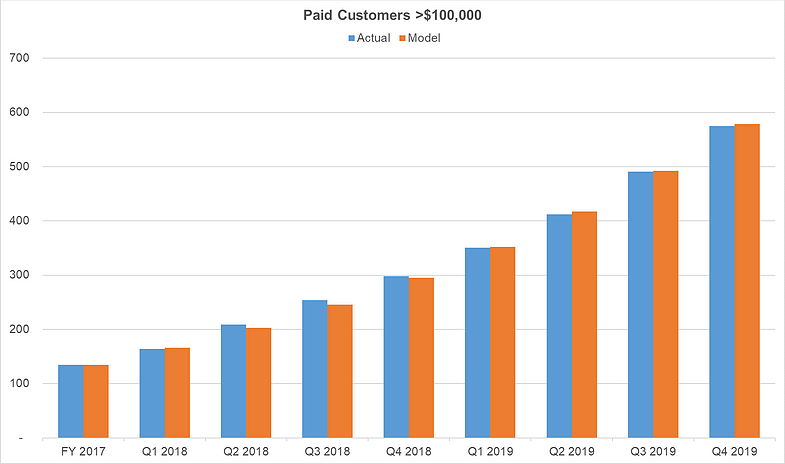
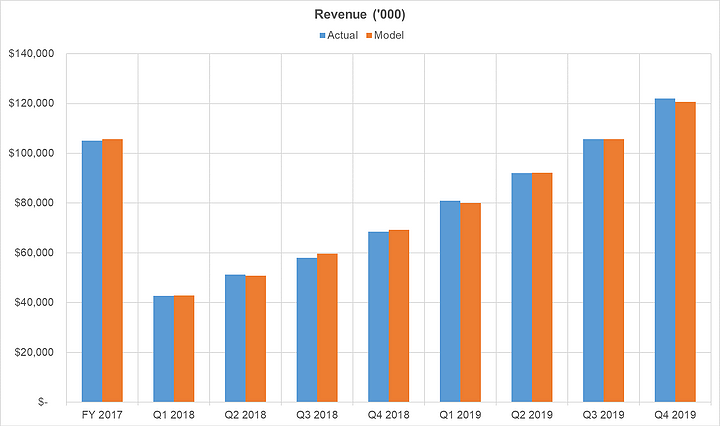
Bringing all of the various processes – acquisition, retention, and spend – together into revenue estimates, we see very strong correspondence between the actual data and our model-based expectations of it, both for the total revenue and revenue from “heavy” customers:
It is interesting to note that, even though all cohorts demonstrate strong revenue expansion over time, they do have somewhat different dynamics. This variation is more obvious when we convert Slack’s C3 disclosure into a chart showing its cohort-specific “left-aligned” ARR per acquired customer (i.e., by dividing each cohort’s revenue over time by the estimated number of customers acquired within that cohort, and expressing the resulting revenue per customer figures as a function of the number of months since the customers in that cohort were first acquired):
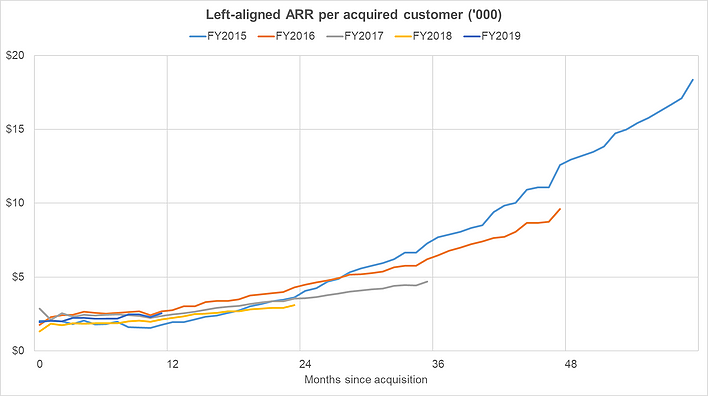
Just to emphasize: this chart, and all of those that follow, are different from the earlier charts because they are not showing data that were disclosed directly in the S-1; all of these figures are inferred from our CBCV modeling process.
Five insights stick out from this chart:
- In the first two years since acquisition, all cohorts demonstrate roughly similar performance.
- After about two years, however, the 2015 cohort ARR outperforms the other cohorts (which could be driven by a rapid expansion of a few heavy early adopters)
- Aside from the 2015 cohort, we see slight deterioration in monetization over time for the 2017 and 2018 cohorts relative to the 2015 and 2016 cohorts
- Initial performance of the 2019 cohort is roughly in line with the 2016 and 2017 cohorts, indicating some bounce back from the relatively underperforming 2018 cohort
- While the 2017 and 2018 cohorts underperform the others, they are still strong in absolute terms. After all cohorts are acquired, their spending grows over time, which does not happen quite so universally for most firms we have analyzed in the past.
We assume that future cohort monetization will be consistent with the overall average performance that we have seen to date. Given the performance of the 2019 cohort thus far, this seems like a reasonable assumption to make.
Also evident from the chart above is the fact that early cohorts demonstrate strong and accelerating revenue expansion, which begs the question: when will the cohort-specific growth slow down and eventually go flat? This is something we can only make assumptions about because Slack has not been in commercial operations for very long. In our analysis, we assume that revenue expansion stops 7 years after customers are acquired. We believe this is reasonable because we see no signs of within-cohort revenue expansion slowing down in the observable data, even 5 years after customer acquisition. However, as new data comes in (if, as we hope, Slack continues to disclose its C3 figures over time), we would closely monitor this important dynamic.
Results: customer acquisition cost
As with many other companies, Slack disclosed its aggregate Sales and Marketing expense, but didn’t indicate how this expense was allocated between new and existing paid customers. For simplicity and consistency with our previous analyses, we define CAC to be total Sales and Marketing expense in a period divided by the number of acquired paid customers in the same period. Strictly speaking, this may over-estimate the company’s actual CAC, depending on how much of the expense is earmarked for new customers versus existing ones, but we believe that this is a fair assumption in the absence of additional information. Moreover, it is unlikely to substantially bias our resulting CLV estimates because baking less of S&M into CAC will decrease CAC but will also decrease the future profitability of customers, making the net effect not so large. You could equivalently consider this CAC figure to be roughly equal to the net present value of all future S&M expenses per customer.
Even though Slack didn’t disclose its gross customer acquisitions, our model was able to infer them using the C3 chart and other customer metrics. For example, in FY2019, our model suggests that Slack acquired about 32,000 new paid customers.
Dividing Slack’s $233.2 million Sales & Marketing expense in the FY2019 by the 30,000 paid customers we estimate that it acquired that year, implies CAC of about $7,700. Expanding this logic to the other cohorts, we can see the evolution of CAC over the last three years in the chart below:
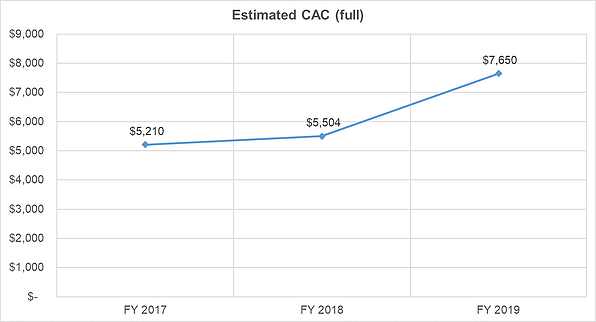
At first glance, CAC may seem quite high, but keep in mind that: (1) B2B firms tend to have much higher CACs (and post-acquisition customer valuations) than B2C firms; (2) CAC is calculated per acquired paid customer, whereas S&M expense includes costs related to all users, including free customers (brand promotion, hosting, customer experience and technical operations, etc.); and (3) the notion of “high” CAC is only relevant compared to the profitability of customers after they have been acquired; as long as customers’ post-acquisition value (PAV) is well above CAC, then it is completely fine for a firm to have a high CAC.
It is also evident from the chart above that CAC jumped by ~40% in FY2019. This is primarily driven by a 66% increase in S&M expense outstripping the more moderate 20% increase in estimated gross acquired paid customers. Even though this is a significant increase in CAC, it still remains far below PAV, so the return on CAC remains exceedingly high (1,000%+). As such, spending more to acquire new paid customers is still NPV positive, but it is important to keep a close watch on this chart to see whether and how this rising CAC trend continues in future years.
Results: Post-acquisition value (PAV)
Next, we turn to how much customers are worth after they have been acquired, breaking that post-acquisition value (PAV) into customer retention, revenue dynamics, and the variable margin on those revenues.
Customer retention
Even though Slack did not disclose its customer retention numbers, our model infers that its retention curve is relatively flat. The model estimates that only ~10% of newly acquired paid customers churn in the first year since acquisition and that 80% of paid customers will still have paying relationships with Slack 5 years later:
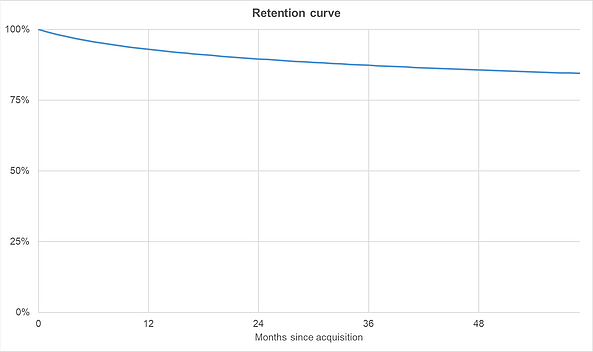
This strong retention profile implies that acquired customers have extremely long lifetimes and can be thought of as being akin to annuities once they have been acquired. Note that while 10% of customers churn in their first year, this does not imply a 1/10% = 10 year average customer lifetime (as a typical simplified analysis would suggest); the average lifetime of paid Slack customers is far longer than that. Such longevity explains why Slack can pay such a hefty CAC to acquire its customers and still be very profitable in NPV terms – the majority of those customers will stay with the company for many years, giving the company ample time to recoup its initial investment and then some.
Customer spend
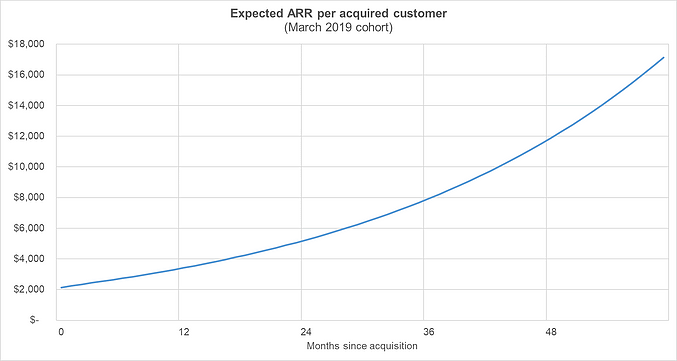
Not only do customers remain with Slack for long periods of time, they also tend to spend more as the length of their relationships get longer. For example, our model suggests that, if an average paid customer acquired in March 2019 stays alive for 5 years, their spend is expected to grow 8.5x from ~$2,000 in their first year to $17,000 in their fifth year. This usage growth is also evident from the C3 disclosure. To avoid extrapolating this growth into infinity, we assume the usage growth goes completely flat 7 years after customer acquisition.
Of course, we should be cautious about making long-term revenue forecasts, especially with such high growth rates, based on no more than five years of data. Discounting future customer cash flows using an appropriate discount rate partially addresses this problem, but as with any model, if the new data suggests that more recent cohorts exhibit deteriorating behavior, we should update forecasts accordingly. As of now, though, judging by the above-mentioned left-aligned ARR charts by cohort, the 2019 cohort behavior is on par with the better cohorts in the past.
Customer spend heterogeneity
In addition to traditional metrics such as the number of paid customers and total revenue, Slack also disclosed the number of “heavy” customers (>$100,000 in ARR) and total revenues generated by them. These disclosures are a nice acknowledgement of a core principle of customer centricity that not all customers are created equal. The disclosed numbers reveal striking heterogeneity – in FY2019, “heavy” customers generated about $350,000 of annual revenue per customer on average (40% of the FY2019 revenues divided by the average number of heavy customers throughout the fiscal year), whereas the remaining customers generated “only” about $3,000 of annual revenue each for Slack. Baking this heterogeneity into spend required us to further extend the methodology from our aforementioned Journal of Marketing paper (gory details are omitted here but we are happy to share them with those who are interested).
Cash flows and customer value
Next, we combined all of these behavioral models together to predict the future variable profits of customers and ultimately, customers’ overall post-acquisition value (i.e., the net present value of all future variable profits after acquisition). The chart below shows our projections for monthly expected revenue per acquired customer for customers acquired in March 2019 over the ensuing five years:
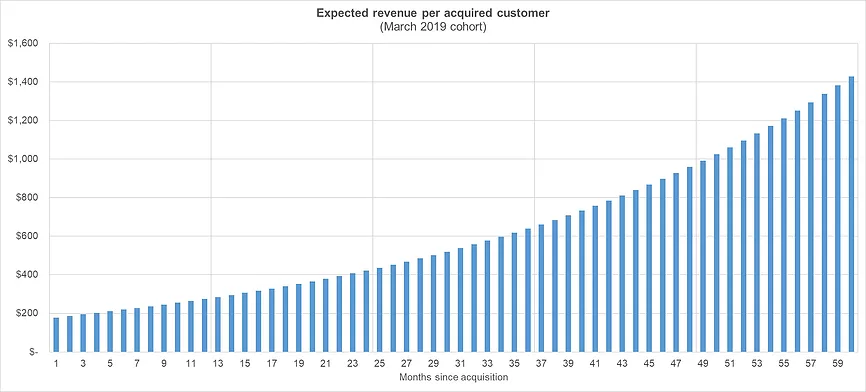
Expected revenue per acquired customer consistently grows due to strong revenue expansion, which is only partially offset by relatively small churn. After 7 years, when revenue expansion is assumed to go flat, expected revenues will start to slowly decline due to churn of remaining customers.
All told, we estimate that the average net present value of all the future revenues associated with a recently acquired Slack customer is about $188,000 (assuming a WACC of 12%).
To estimate customer post-acquisition value, we need to multiply these revenues by Slack’s variable profit margin. We make the following assumptions about company’s variable cost margins:
- Cost of Revenue: Slack has shown a consistent gross margin of ~87% in the FY2018-2019. We assume they will maintain this level going forward. This is in line with the firm’s long-term target gross margin.
- R&D: Slack’s R&D is focused on maintaining and enhancing existing functionality of, and adding new functionality to, the Slack platform. It includes both fixed and variables costs. Between the FY 2017-2018, it has decreased from 57% to 30% of revenue (except for Q4 2018 when it spiked to 90% of revenue). Slack’s long-term target R&D margin is 20-23% or 21.5% at the midpoint. This long-term expense is assumed to be an effectively variable cost.
- G&A: We also assume this expense is partially fixed and partially variable. Currently, it is about 28% of revenue. Slack expects that over the next several years it will fall to 8-10% of sales, which is an upper-bound margin for more mature tech companies. We use the midpoint 9% G&A margin as an effectively variable cost.
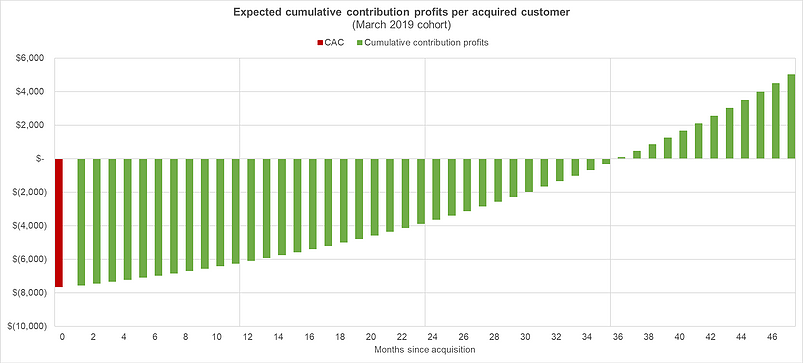
Based on these variable profit assumptions, and using a 12% WACC, we estimate the post-acquisition value of a recently acquired customer at $107,000, or about 57% of the revenue PAV. Netting out the $7,700 Slack spends to acquire paid customers would imply that the average CLV of a paid Slack customer is ~$99,000, and that Slack’s return on CAC is more than 1,200%. Such a hefty marketing ROI explains why the FY2019 CAC spike (and the high level of CAC in an absolute sense) is not a concern to us – given this margin, it is actually a good decision to increase marketing spend in the short run to acquire customers that generate over 10x in contribution profits over their lifetime.
The model also allows us to estimate the CAC payback period, or how long it takes before Slack recoups its CAC through variable profits on an undiscounted basis. We infer that it takes about 3 years on average for a newly acquired customer to generate enough in contribution profits to pay for its CAC. Such a long payback period explains why Slack’s business model is a long-term game and why the company is actually incentivized to incur operating losses today – doing so pays off nicely in the long run, as long as it is able to keep its currently high retention rate. As the company matures, this also implies that the company may benefit from increasingly financing its growth through debt. The variable profits from customers appear stable enough to borrow against and doing so could have the dual benefit of bringing down the firm’s WACC.
Variation in PAV across customers
As we mentioned previously, the data and the model imply a high level of variability in the “goodness” of Slack’s customers – a small (<1%) segment of “heavy” customers accounts for 40% of company’s revenues and generates revenue per customer which is more than 100 times larger than everyone else. We estimate that the top 1% of customers have an average PAV of about $4.9M while the remaining 99% of customers have a PAV of only $56K. The top 1% accounts for almost 50% of total existing customer value.
Moreover, our spend model suggests that up to 75% of recently acquired customers have PAV which is less than Slack’s FY2019 CAC of $7,700. This implies that Slack may be losing money on 75% of the customers that they acquire, but that the remaining 25% more than make up for it. To be fair though, it probably costs Slack less to acquire smaller prospects than larger ones. For larger prospects, Slack would need more support from the sales team to facilitate a roll-out across a large organization, for example. In the absence of more granular data, the 75% number is probably a reasonable upper bound on the number of loss-making customers. We would also caution readers that Slack only provided two data points related to spend heterogeneity (the number of heavy customer and their revenue over time), providing us with a somewhat limited amount of data from which to pin down the exact distribution of customer spend. While the inferences we draw are fully consistent with Slack’s disclosures, the lack of data may imply some degree of uncertainty in the exact numbers.
Despite these caveats, it remains very clear that Slack’s customer concentration is fairly extreme. This high level of customer concentration implies risk for potential investors – Slack’s path to profitability will hinge on its ability to retain and develop the segment of its “heavy” customers as well as continue acquiring these “whales” in coming years.
Conclusion
Despite the significant financial losses Slack is currently incurring, running Slack’s S-1 data through our CBCV model suggests that the company acquires customers very profitably (and that this would be true even if CAC were to, say, double from its current levels). It generates $107,000 in post-acquisition value per customer on average, well north of its current $7,700 customer acquisition cost, but this customer profitability is very back-end loaded – the average payback period on newly acquired customers is about three years. The profitability of currently acquired customers is largely driven by high retention, strong revenue expansion, and spend heterogeneity – Slack’s top 1% of customers are expected to generate about 100x in value per customer than the rest of the customer base, accounting for almost 50% of total existing customer value. The longevity and revenue expansion of higher-spend customers makes up for the fact that up to 75% of Slack’s customers do not generate enough contribution profits to offset their acquisition cost.
A natural follow-up analysis to this one would be to convert these customer-value insights into an overall fair valuation estimate. Even though Slack turns a variable profit on customers, which will allow it to grow out of its current losses over time, it still remains to be seen how long it will take for this to happen, and whether the volume of future profits Slack may generate in the future would justify its target valuation. This is largely a function of the volume of customers we can expect Slack to acquire in the future, and how Slack’s variable profits compare to its fixed cost overhead. We plan on doing in a follow up to this post. Stay tuned! (Slack valuation post is published here)
Update: this analysis was updated to reflect additional data disclosed by Slack on May 13 (preliminary results for Q1 2020 and long-term target margins) and 12% WACC assumption derived from the analysis of comparable SaaS firms.
May 9, 2019 (updated on May 16, 2019)
Peter Fader is the author of “The Customer Centricity Playbook” and a co-founder of Theta Equity Partners. Daniel McCarthy is a co-founder and Val Rastorguev is a Director of Theta Equity Partners, a company specialized in Customer-Based Corporate Valuation services — valuing firms by forecasting what their current and future customers will likely do.This article is for informational and educational purposes only, you should not construe any such information or other material as investment, financial, or other advice. Nothing contained in this article constitutes a solicitation, recommendation, endorsement, or offer by Theta Equity Partners to buy or sell any securities or other financial instruments.