Revolve IPO: Solid Unit Economics Drive a $1.7-2B Fair Valuation

Online fashion retailer Revolve Clothing first filed with the SEC to IPO in late September 2018 (S-1 filing). After that, the company went completely silent about the IPO for many months … until last week, when the company finally announced a target IPO price range of $16-18 (a ~$1.2B valuation), to begin trading on June 7th. In stark contrast to most (if not all) other high-profile companies that have gone public recently, Revolve is more mature (founded in 2003), growing at a relatively slower rate (25-30% annually compared to a more typical 80-100%+) and is actually profitable. Revolve generated $42M in operating profit on $500M net sales in 2018, and its impressive 8% operating margin was up from 2% in 2016.
In this post we apply our Customer-Based Corporate Valuation framework (CBCV) to analyze Revolve’s unit economics, and then bring in additional economic/accounting details to assess the attractiveness of its $1.2B target valuation.
Cutting to the chase, these are our main conclusions:
- Healthy unit economics. We estimate that on average, newly acquired customers generate ~$200 in contribution profit CLV, netting ~$300 in post-acquisition value (PAV) against ~$100 in fully-loaded CAC, resulting in ~200% total marketing ROI. Revolve acquires customers profitably with a good safety margin and at a reasonably stable cost.
- Slight degradation in post-acquisition value across cohorts. If there is one thing to watch for in coming quarters, it is degradation in the goodness of customers across cohorts. We estimate that on average, each consecutive monthly acquisition cohort generates ~$2-3 in 12-month sales per customer less than the cohort that preceded it. If this trend persists, the CLV of future customers will go down but nevertheless remain healthily positive.
- Strong customer heterogeneity. Customers’ loyalty to the firm differs considerably across the customer base – while many customers have very low loyalty, we infer that 20-25% of customers will remain active with the firm for many years to come.
- Justified target valuation with upside potential. If Revolve is able to continue acquiring customers with unit-level performance comparable to what we have seen to-date, unlocking additional operating leverage in the process, we estimate its fair equity value at $1.7-2B or 40-60% above the midpoint of the firm’s target valuation ($1.2B). Decreasing WACC by 1pp from 12% to 11% increases the firm’s fair value by $300M. If we conservatively assume that Revolve is only able to maintain its current margin levels, our valuation estimate would be $1.2-1.4B, which is still at or above the target valuation.
Next, we summarize the available data, then specify and validate our model for the firm. Finally, we will discuss in detail the conclusions summarized here.
The Data
As usual, we were excited to see the Customer Cohort Chart (“C3”) in Revolve’s S-1 filing, breaking down total net sales by customer acquisition cohort:
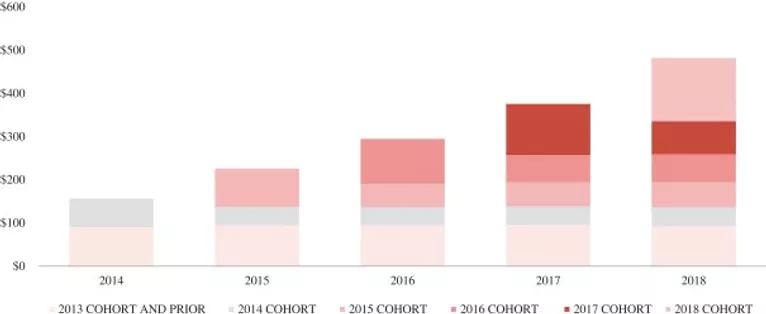
This is a very insightful chart. A couple of highlights stick out:
- The share of sales from existing customers has been increasing and reached ~70% in 2018 despite solid growth in the size of the customer base. This implies the firm is not so reliant on new customer acquisition and therefore its ability to keep marketing expense under control (it has done a good job to date in this regard, as marketing expense is less than 15% of net sales).
- We also observe that each cohort demonstrates remarkable revenue stability after the first year of acquisition. While some customers drop out quickly, there’s a segment of highly loyal customers who will stay with the company for many years to come. Our modeling results confirm this observation (more on this below).
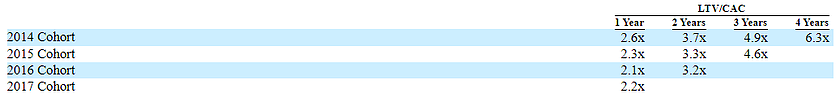
Revolve went even further and also disclosed some of its customer value metrics as well. For example, it showed that customers acquired in 2014 generated $188 in contribution profits on average over the next four years, which was 6.2 times higher than their customer acquisition cost (CAC) of $30 in 2014:
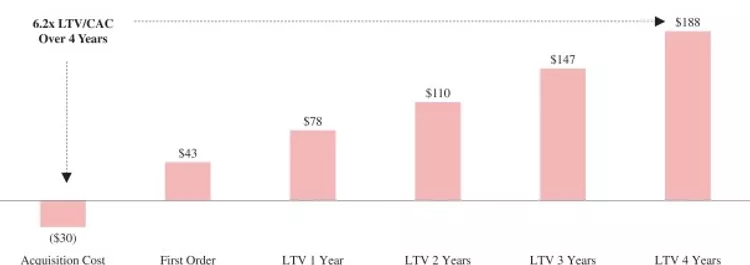
While we have all the usual reservations about conflating historical profitability with LTV (e.g., what Revolve calls a “3 Year LTV” we would call historically realized value over 3 years), these disclosures indicate that management is focused on the right metrics, and has done a good job to date in managing those metrics relative to their peers.
Besides the C3, Revolve also disclosed active customers, total orders placed, and net sales, providing us with enough customer-level data to apply our CBCV models to infer unit economics and overall company valuation.
The Model
The model that we use is essentially the same model that we applied in our analysis of Farfetch and Lyft and is an extended version of the model we used in our paper on valuing non-subscription businesses (SSRN) published in the Journal of Marketing Research.
We posit models for the flow of customer acquisitions over time, how long acquired customers remain with the firm after they have been acquired, the number of orders they place while they are “alive” as customers, and the amount they spend on those orders. We estimated the parameters of our models that, when combined together, are most consistent with the observed data. As it turns out, our model fits the data remarkably well along all of the various data points that Revolve disclosed.
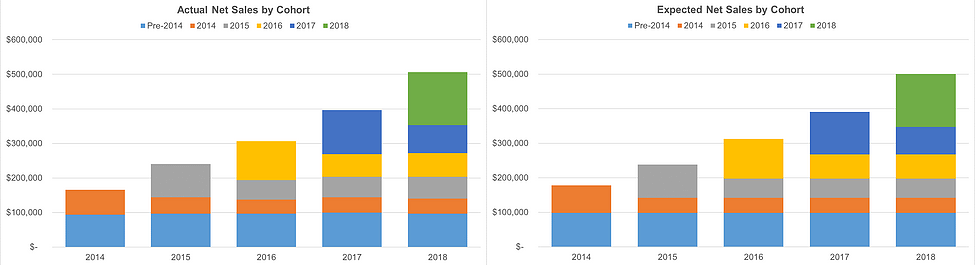
Here is the actual vs. model-implied Customer Cohort Chart:
Other customer metric charts:
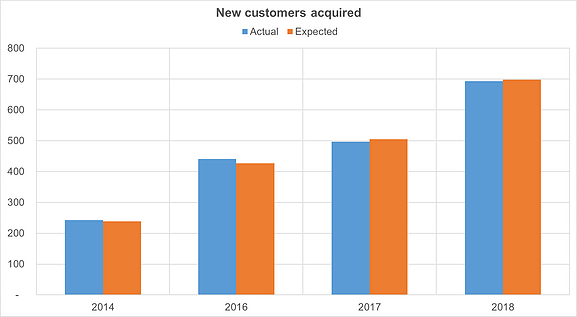
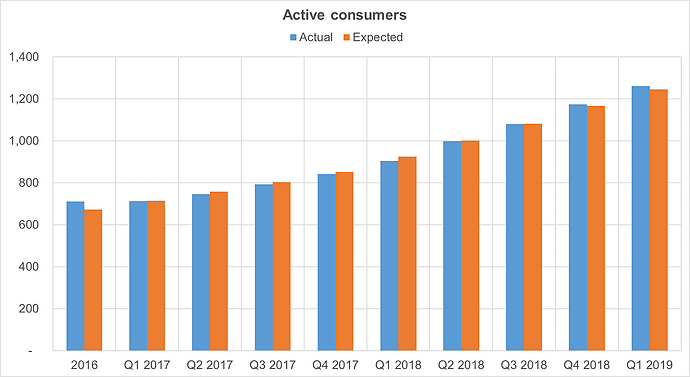
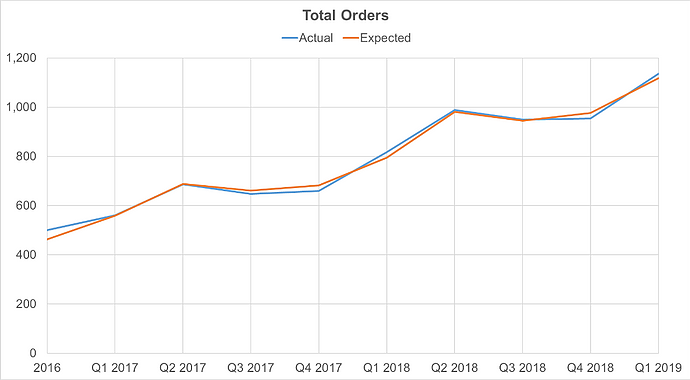
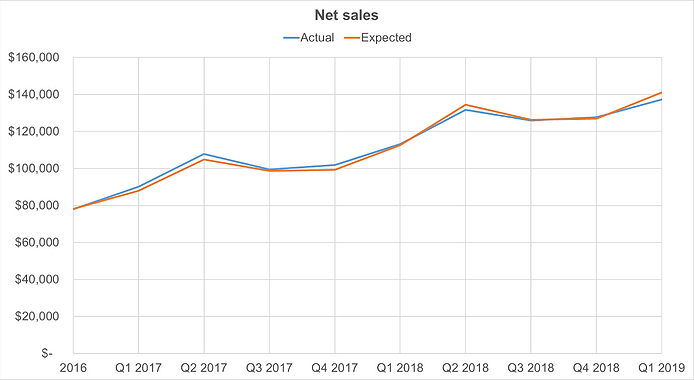
Bringing all of the various processes – acquisition, retention, repeat purchasing, and spend – together into revenue estimates, we see very strong correspondence between the actual data and our model-based expectations of it:
Results: post-acquisition value
Given the strong empirical validity of the model we have fitted, we can explore what it suggests about the underlying unit economics of the business next.
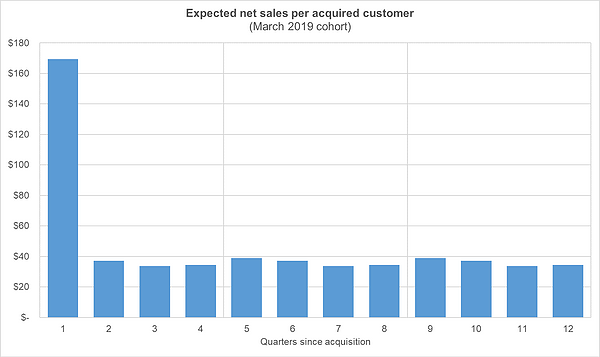
Our model suggests that customers’ loyalty to the firm differs considerably across the customer base – many customers have very low loyalty, while others will likely remain with the firm for many years to come. For example, we estimate that 20-25% of customers will still be with the firm for 5-10 years. Because of this, there is a fairly sharp drop-off in overall cohort activity right after a new customer cohort is acquired, as customers with low loyalty quickly churn out. After that initial shakeout, the number of customers who stay with the firm remains relatively steady. We also infer that spend of customers who stay with the company has remained largely flat with minor seasonal fluctuations, resulting in the following projection for total quarterly sales per customer after acquisition:
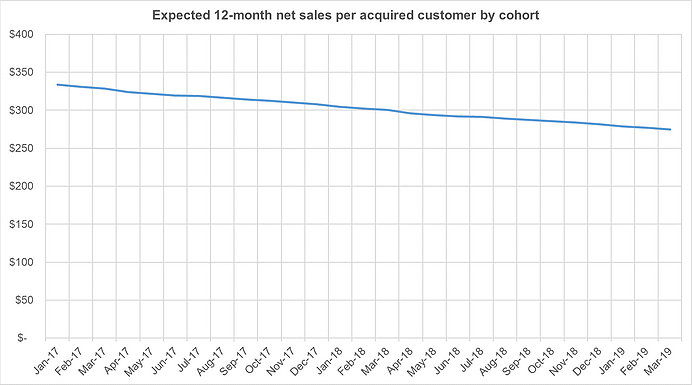
Our model also suggests slightly declining quality of more recently acquired customers compared to customers acquired longer ago. We estimate that on average, each consecutive monthly acquisition cohort generates ~$2-3 in 12-month sales per customer less than the one before:
This implication is supported by Revolve’s observable data (which we did not use to train our models). Revolve disclosed that its 1-year LTV/CAC declined from 2.6x for the 2014 cohort to 2.1x for the 2016 cohort, even though according to the firm, “annual CAC remained relatively steady from 2014 to 2016”.
This deterioration of cohort performance is somewhat concerning, but at the same time quite typical for online retailers. As companies grow, it becomes increasingly difficult for them to acquire customers of the same high quality as the pool of “good customers” is getting exhausted and the company has to go beyond its core audience to support growth. All told, we estimate that the average net present value of all the future net sales associated with a recently acquired Revolve customer is about $1,200 (assuming a WACC of 12%).
Turning from revenue to variable profitability, we make the following additional assumptions:
- Gross margin. We assume that Revolve’s gross margin remains constant at its current level of 53.2%. The firm expects its gross margin to “fluctuate as a percentage of net sales primarily due to how we manage our inventory and merchandise mix”, therefore keeping it constant appears to be a reasonable assumption in the long run.
- Fulfillment expenses. In line with company’s directional guidance, we assume that in the long run fulfillment expenses as a percentage of net sales will go down from current 2.7% to ~2% due to operating leverage as the company continues to grow.
- Selling and Distribution expenses. We similarly assume that selling expenses will slightly decline from current 14.2% to 13.5% of net sales (the average over the last three years) in the long run due to operating leverage.
- G&A expenses. Even though the firm does not include any portion of G&A in variable expenses, we assume this expense is partially fixed and partially variable. Currently, it is about 13% of net sales. In line with the firm’s directional guidance, we assume that in the long run G&A will fall to 11% of sales, which would be an effectively variable cost.
Based on these variable profit assumptions, and using a 12% WACC, we estimate that the post-acquisition value of a recently acquired customer is $300. Next, we explore how customer value compares to what Revolve spends to acquire and retain these customers.
Results: customer acquisition cost
Before diving into our analysis of Revolve’s CAC, we note that the firm internally uses marketing expense attributable to acquiring new customers to calculate CAC, but unfortunately, they do not disclose these numbers systematically. Because of this (typical) data limitation, we follow our usual convention of calculating a “fully-loaded CAC” which is equal to total marketing expense divided by the total number of acquired customers in the same period. Strictly speaking, this will over-estimate the company’s actual CAC and payback period, depending on how much of the expense is earmarked for new customers versus existing ones, but we believe that this is a fair assumption in the absence of additional information. As we have noted in previous posts, this assumption is unlikely to substantially bias our resulting CLV estimates because baking less of marketing expense into CAC will decrease CAC but will also decrease the future profitability of customers, making the net effect not so large.
Dividing Revolve’s $74 million marketing expense in 2018 by the 700,000 customers we estimate that it acquired that year, implies a fully-loaded CAC of about $107 (this compares to Revolve’s reported CAC of $38). Expanding this logic to the other cohorts, we can see the evolution of CAC over the last three years in the chart below:
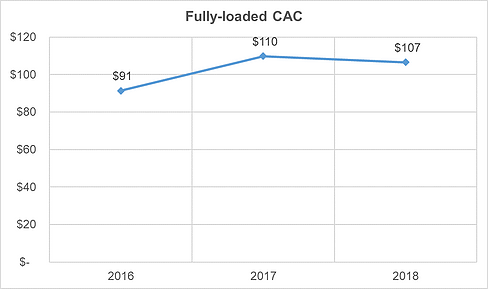
We see that CAC increased by ~20% in 2017 and then slightly decreased in 2018, which is also consistent with the company’s disclosures – in 2017, Revolve “increased its marketing investments in REVOLVE segment and its higher-margin owned brands, while also focusing on acquiring full-price customers who they believe will have higher LTV.”
While CAC is still higher than it was in 2017, the firm still acquires customers quite profitably. Netting out the $107 fully-loaded CAC from the post-acquisition value of $300 for recently acquired customers implies that the average contribution profit CLV of new customers is ~$200 and the total return on marketing expenses is 180-200% (for comparison, we estimated Farfetch’s marketing ROI at 400%+ and Lyft’s at 60%).
Next we analyze how Revolve’s healthy unit economics translates into an overall company valuation.
Valuation: if unit economics remain at current levels, the fair equity valuation is $1.7-2B
As we have now done a number of times in the past, we use this fitted model for the flow of new customers acquired, their repeat orders, and the amount spent on those orders to generate revenue forecasts over time. These are the main additional assumptions we make to generate long-run revenue forecasts and translate those revenue forecasts into free cash flow estimates (and ultimately, an overall company valuation estimate):
Weighted average cost of capital (WACC). Revolve’s capital structure is 100% comprised of equity, and comparable online fashion retailers have equity cost of capital ranging from 9.5% to 14%, averaging to 11.4% (source: Bloomberg). Therefore we assume, rather conservatively, that Revolve’s WACC is 12%. We note that since ~20-25% of Revolve’s customers are very long-lived, a substantial portion of the firm’s value is coming from future periods, making Revolve’s fair valuation estimate sensitive to WACC, as we will see in the valuation results below. But considering its highly stable and predictable future cash flows, the firm could reduce its WACC below this level through a reversion of WACC to that of its peers, and even further still through debt financing.
Total addressable market. We assume the total number of people who may eventually be acquired by the firm is 150MM. This estimate is based on the population of Revolve’s target markets (US, Canada, EU, and Australia) that falls into their core audience (18-44 years old, mostly women). As is our usual convention, we include a parameter in the model to allow for some proportion of prospects to never be acquired, so that the data can tell us what the effective size of the market is.
Under these assumptions, we estimate fair equity value of Revolve at $1.7-2B. This represents a 40-60% upside compared to the midpoint of the firm’s target price range ($16-18 per share).
If we assume, much more conservatively and against company’s guidance, that long-term margins will remain at their current levels (i.e. no further operating leverage), the valuation range is still $1.2-1.4B, which is at or 20% above its target valuation. Finally, if Revolve’s WACC decreases by 1pp to 11%, their fair valuation increases by $300M.
All in all, considering Revolve’s healthy unit economics and assuming they are able to maintain it going forward, we believe it presents an attractive investment opportunity at the target $16-18 stock price range.
June 7, 2019
Peter Fader is the author of “The Customer Centricity Playbook” and a co-founder of Theta Equity Partners. Daniel McCarthy is a co-founder and Val Rastorguev is a Director of Theta Equity Partners, a company specialized in Customer-Based Corporate Valuation services — valuing firms by forecasting what their current and future customers will likely do.
This article is for informational and educational purposes only, you should not construe any such information or other material as investment, financial, or other advice. Nothing contained in this article constitutes a solicitation, recommendation, endorsement, or offer by Theta Equity Partners to buy or sell any securities or other financial instruments.