Warby Parker – healthy unit economics despite relatively low purchase frequency

Introduction
On August 24, 2021, Warby Parker, an eyewear company and one of the pioneers of the digitally native vertical brand movement, filed its Form S-1 with the SEC to become a publicly traded company through a direct listing (Direct Public Offering, or DPO). In August 2020, the company completed a private funding round at an implied valuation of $3 billion. Was that valuation reasonable considering that the company was able to chalk up “only” 20% average annual revenue growth between 2018 and 2020 and is still unprofitable? We used our Customer-Based Corporate Valuation (CBCV) methodology, which allows us to more accurately value companies by predicting what their customers will do in the future, to answer these questions.
Our CBCV analysis consists of two parts: (1) a “deep dive” into Warby Parker’s unit economics to gain deeper insight into the health of its customer base and (2) an overall company valuation analysis to estimate the fair value of its equity. We start with the first of the analyses of Warby’s unit economics in this note.
For those short on time, here is a summary of our main findings:
- Overall, Warby Parker has healthy unit economics – for example, we estimate that the cohort of customers acquired in June 2021 has a PAV (Post-Acquisition Value) to CAC (Customer Acquisition Cost) ratio of 2.3-3.2x, implying a marketing ROI of 126-219%.
- Strong customer heterogeneity. Our models imply that customers are quite different in terms of their behavior – some customers come back to make purchases at Warby Parker infrequently, while others customers stay much longer and make many more repeat purchases.
- Purchase frequency is relatively low – a cohort generates its first repeat purchase, on average, after 4 years. Of course, this is to be expected for an eyewear company.
- That said, repeat purchasing is strikingly consistent, both across acquisition cohorts and over time, making us relatively more confident of their ability to keep getting customers to come back.
- Warby Parker’s actual customer acquisition costs are higher than disclosed, at ~$55 in 2020 (compared to $40 that the company disclosed).
- On average, newly acquired customers generate ~$70-121 in profit-based CLV, net of CAC.
- After customers are acquired, they “pay back” acquisition costs after the first transaction. This implies that Warby Parker isn’t taking on a significant amount of risk at its current level of CAC – repeat transactions are pure “icing on the cake” and not required to break even on what it spends to bring customers in.
We were delighted to see that Warby Parker disclosed a large collection of customer-related metrics, arming us with more than enough data, in conjunction with traditional financials, to be able to pin down the sort of acquisition / retention / order / spend CBCV model that we’ve come to be known for. To be specific, Warby Parker disclosed its entire customer acquisition trajectory since inception (at least they said they did – we identified a number of important issues with that chart that made it pretty much unusable), annual customer acquisitions over the past three years, quarterly active customer data for more than the past four years, customer acquisition cost data over the past three years (although we spotted that this too had some issues that required further adjustment – more on this below), and even sales retention by acquisition cohort for the past five years. This is one of the most complete collections of customer-related data that we have ever seen.
The Data
Before diving into predictive models, we thought it would be instructive to first take a look at the raw data as it sits to get a better qualitative sense for how the company has been doing.
Active customers
Let’s start with active customers. The chart below suggests that the number of active customers at Warby Parker has been increasing steadily since 2017, except for a decline in 2020 due to COVID.

Source: Warby Parker
New customers
Although we weren’t able to use the customer acquisition curve chart, Warby Parker shared a breakdown of new vs. returning customers as a percentage of active customers. The new customer percentages allowed us to calculate the number of new customers acquired in the 2018-2020 period, as shown in the table below. In addition, the chart shows that the percentage of returning customers increased from 2018 to 2020, which Warby Parker called out as a sign of healthy customer retention.


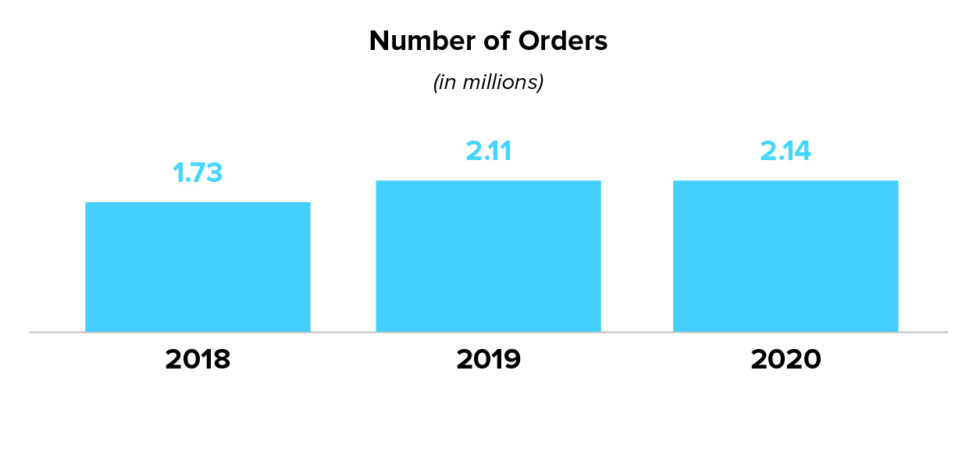
Total orders
Total orders have been increasing consistently with active customers.
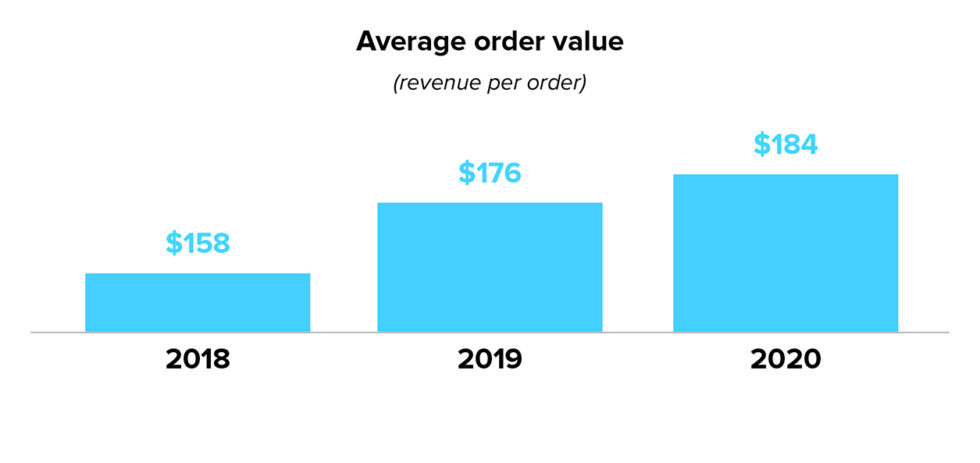
Average Order Value
Average Order Value (AOV) increased in 2019 and 2020, driven by a shifting product mix.
Sales Retention by Cohort
Warby Parker boasts a near 100% sales retention rate 48 months after acquisition across the 2015-2019 customer cohorts, which is reflected in the chart below. It is also interesting that these yearly customer cohorts exhibit strikingly consistent and regular repeat spend dynamics, giving us more confidence that these trends are likely to persist into the future. As always, we will need to turn to the CBCV models to fully understand what underlies the observed data and forecast key dimensions of customer behavior, which we will dive into in the next section.

The Model
The modeling framework is similar to that used in our former analyses or Slack, Lyft, Revolve, and others. Like the previous analyses, the Warby Parker models follow the principles introduced in our paper on valuing non-subscription businesses published in the Journal of Marketing Research (SSRN).
For those less familiar with CBCV, we model the following customer behaviors: the flow of customer adoptions over time, how long those customers remain with the firm after they have been acquired, the number of transactions made while they are “alive” as customers, and the amount they spend on those orders. One of the key advantages of the models is the ability to accommodate any form of aggregated financial or customer data disclosed, as the choice of what types and how many customer metrics to include in the filings tend to vary from firm to firm. We estimate parameters of the models so that the model-implied data aligns closely with the disclosures provided by the firm. As shown in the validation charts below, the model fits were quite good.
Below are the actual vs. model-implied validation charts for new customers, total orders, average order value, net sales, and active customers:


Last but not least, this is a plot of actual versus expected sales retention:


As you can see, all model fits were impressive, especially when you consider how simple our model was. Indeed, we only included a single covariate to account for the adverse impact of COVID on the business on two of the aforementioned processes – acquisition and repeat purchasing. For the spend model, we include only two covariates – one to allow for spending to trend in calendar time, and another to allow it to vary as a function of customer tenure. That’s it! As we are wont to say, we shave with Occam’s Razor.
Results: Customer Acquisition Cost
In order to estimate CLV and evaluate the quality of the customer base, it is important to get CAC right (since CLV, as we define it, deducts CAC). Warby Parker defines CAC to be “acquisition costs for a given period divided by number of active customers during the period.” This is highly unusual. In fact, we haven’t seen a single other company define CAC this way. A more proper definition of CAC is total customer acquisition costs in a given period divided by the number of acquired customers during that period, not the number of active customers. We understand that the company’s rationale for using this definition might be that the expenses they call “acquisition expenses” — media plus home try-on costs — are driving both first-time and repeat orders . But if this is true, then the numerator should not be called “acquisition costs”, because they aren’t.
Instead of using an incorrect definition for CAC because some of their “acquisition” expenses are not actually acquisition expenses, we would recommend that the company instead define CAC correctly, with the numerator representing marketing/try-on expenses that are only driving new customer acquisitions, and the denominator representing the number of new customer acquisitions. Since Warby Parker does not separately break out media plus try-on expenses for new vs. existing customers, we assume that 80% of these expenses are earmarked for new customer acquisition, given that the company is still in a relatively early stage of its lifecycle. All told, we estimate that Warby Parker’s true CAC figures are thus $32, $35, and $55 over 2018-2020, which are 20-40% higher than their disclosed CAC figures. We use these corrected CAC figures in the analyses that follow.

Results: Post-Acquisition Value
In this section, we will dive into the question of how much the customers are worth after they have been acquired (i.e., their “post-acquisition value” or PAV), by forecasting retention, repeat purchase frequency while retained, revenue per purchase, and variable profitability. Overall, our model shows that Warby Parker unit economics are strong.
Repeat purchase frequency
It is important to understand how many purchases a customer makes after acquisition. Based on our model, the rate at which alive customers make repeat purchases varies widely across the customer base. Many customers make only one purchase and never come back, while others come back and make many repeat purchases. We found that on average, a customer makes about 2 purchases within the first four years (48 months) after acquisition. Granted, such repeat purchasing frequency is not particularly impressive, but let’s not forget that this is not a high-frequency product category. At the end of the day, the key question is whether the company makes enough profits over his/her lifetime to offset CAC, and brings in enough customers at these economics to pay for fixed cost overhead, and eventually turn a profit.

Average Order Value
The S-1 discusses that historical increases in AOV is driven by the “ability to introduce and scale new products or service offerings” to customers. Higher unit mix of the more expensive progressive lenses as well as new lens offerings were listed as factors for Warby Parker’s rising AOV in the last few years. The company reported that its AOV increased from $158 in 2018 to $176 in 2019 to $184 in 2020. Our model also infers an increase in revenue per order since 2018, consistent with the historical numbers. The data suggests that this favorable mix shift tapers off over time.
Customer Value
Combining results from the various customer behavior models, we then project future revenue per acquired customer over his/her lifetime. The chart below shows cumulative revenue per acquired customer, for an average customer acquired in June 2021. This chart is fully consistent with the sales retention data that we had shown earlier, giving us confidence that the trends we observe here are valid. We can see that cumulative revenue plot per acquired customer grows almost linearly over the first five years since acquisition, indicative of solid revenue retention That being said, we forecast that cumulative revenue flattens thereafter — we would not expect this trend to continue on indefinitely.

In order to estimate Warby Parker’s contribution-profit-based post-acquisition value, we must estimate the variable profit margin. The S-1 includes a chart (shown below) breaking down Warby Parker’s contribution margin:

Based on the variable cost percentages disclosed in the chart, we make the following assumptions:
- COGS per customer: COGS stays relatively constant from 2018 to 2020, so we assume the same percentage – 40% – going forward.
- Selling and service cost per customer: this expense also has also remained relatively flat at ~20% over the last three years, which we assume going forward.
- Customer acquisition spend per customer: while the S-1 deducts customer acquisition cost when calculating the contribution margin, we know this is not the case, as discussed earlier. If it were truly an acquisition cost, we wouldn’t deduct it from the variable margin at all – that would be double counting this expense. However, as we had noted, this expense – media plus home try-on costs – is partly (we estimate 80%) an acquisition expense and partly (we estimate 20%) a driver of repeat orders. We already included the portion of this expense earmarked to acquisition in CAC, so we only deduct the proportion of this expense that we estimate to be driving repeat orders from the variable margin. As a result of this, we estimate that media and home try-on costs lower the variable margin by 6% of revenue on a go-forward basis.
Based on these variable cost assumptions and using a 11% discount rate, we estimate that the post-acquisition value of a customer acquired in June 2021 is between $125 and $176. Why apply a range because we infer that customers continue coming back consistently over multiple years – indeed, in the absence of any outside information, our model would suggest that this consistency will carry on for a very long time to come, which creates an issue, not unlike what we see at Peloton, of having to be overly reliant upon predictions that extend too far beyond the range of our data. This range takes into account our belief that this strong consistency will carry on for somewhere between 5 and 15 years. We believe this admittedly “manual override” is a reasonable one, but ultimately is an assumption that we are making.
After subtracting the acquisition cost of $55 (our estimate of the corrected CAC per customer in 2020), Warby Parker customer’s contribution profit-based CLV is between $70 and $121, implying a return on CAC of between 126% and 219%, or equivalently, a PAV to CAC ratio of between 2.3x and 3.2x.
This is a healthy ratio relative to what we have estimated for other companies we have analyzed and is a testament to Warby’s focus on customer centricity and sound unit economics.
What’s more, our model also implies that Warby Parker is first purchase profitable on a contribution profit basis net of CAC. This is a very good position to be in — it implies that Warby Parker can recycle its customer acquisition expenses quickly, and that any repeat purchasing that Warby Parker generates is pure icing on the cake. Given the significant amount of revenue that Warby generates in the future (despite their relatively low repeat purchase rate per acquired customer), this amounts to a lot of icing.
Conclusion and next steps
The bottom line from a unit economic perspective is a good one – the company is making a lot more money on new customers than it is spending to bring them in, and because it gets paid back immediately, it can acquire many new customers in a very capital efficient manner. But what does this all mean for company valuation? Do these unit economics justify a $3 billion (or higher) valuation? We will answer these questions in the next piece of the series, where we will combine future expected revenues from existing and future customers, account for variable and fixed costs, and build a complete CBCV model.
September 24, 2021
Peter Fader is the author of “The Customer Centricity Playbook” and a co-founder of Theta. Daniel McCarthy is a co-founder, Hallie Gu is a Data Scientist, and Val Rastorguev is a Director of Theta, a company specialized in Customer-Based Corporate Valuation — valuing firms by forecasting what their current and future customers will likely do.
This article is for informational and educational purposes only, you should not construe any such information or other material as investment, financial, or other advice. Nothing contained in this article constitutes a solicitation, recommendation, endorsement, or offer by Theta to buy or sell any securities or other financial instruments.