What happened at Farfetch in Q2 2019? A CBCV Perspective
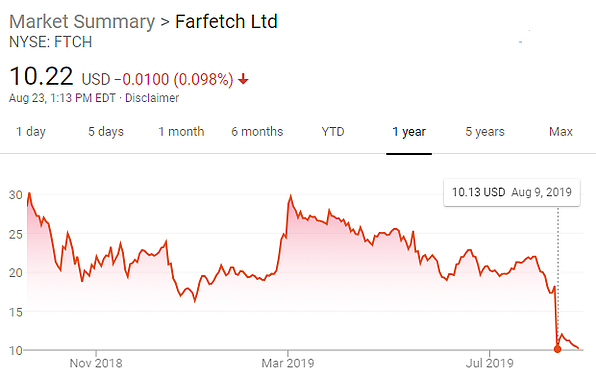
Online luxury fashion retail marketplace Farfetch IPO’d in September 2018 at $20 per share. Its stock, while volatile, had been trading roughly around this same price until it dropped by 40% the day it reported Q2 2019 earnings and announced a $675 million acquisition of New Guards, a luxury fashion production and distribution company. What happened to the company that led to such a drastic change? The emerging science of “Customer-Based Corporate Valuation” (CBCV) provides an excellent lens to answer this question, which we do here.
In our pre-IPO analysis nearly one year ago, we had said the following about their valuation:
If Farfetch is able to continue acquiring customers with unit-level performance comparable to what we have seen to-date and if it is able to bring the G&A margins down to the level of its peers, we forecast that Farfetch’s current valuation is entirely justified on a discounted cash flow basis. Our fair value estimate assuming its unit economics remain stable is ~$20.
We had also noted that this valuation came with a substantial amount of uncertainty:
However, and this is very important, we would caution investors that this valuation depends very heavily upon profits that may happen many years in the future. As such, their valuation is highly sensitive to WACC and to expectations of the longer-term competitive landscape. Farfetch’s valuation uncertainty is very large.
Given the additional year of financial performance we have been able to observe, and the fact that FTCH is now trading at a steeply discounted price of $10 per share, inquiring minds may wonder: what would a bottom-up CBCV exercise tell us about this drop as well as the current attractiveness of the stock at this price?
In this short note, we update our analysis to answer this question.
This is a summary of our main findings:
- Farfetch’s post-IPO aggregate customer behaviors and resulting topline figures remain closely aligned with our pre-IPO expectations
- However, company margins took a big hit since the IPO: their gross margin went down from 51.4% to 46.4% TTM (and 40.7% in Q2 2019) and share-based compensation skyrocketed from ~5% of revenues to ~18% TTM (!). This margin weakness was only partially offset by a decrease in G&A from 43.2% of revenues to 34.7% TTM.
- Our revised fair valuation of Farfetch is $14 per share, but we reiterate that this is very sensitive to margin (and WACC) assumptions which we make very clear below. Valuation uncertainty remains very high.
- Our valuation model suggests that a 1 percentage point change in Farfetch’s long-term EBIT margin target is worth about $2.50 per share. Therefore, if the company is unable to return back to previous gross margin levels and/or keeps granting stock options at their current unexpectedly high pace, expect a significant hit to their fair valuation.
1. Customer behavior
Our pre-IPO customer behavior predictions were spot on, right until the acquisition of Stadium Goods and Toplife in Q1 2019. For example, for Q3 and Q4 2018 we predicted 1.21 million and 1.31 million active customers, respectively, and the actual numbers were 1.22 million and 1.35 million. Comparing the number of orders and platform GMV for the last two quarters of the year is a bit trickier. In the F-1 filing, the company did not disclose its customer metrics quarterly, so we could not, and thus did not, incorporate quarterly seasonality in our original model (which, we would argue, is of secondary importance to valuation anyway). As a result, comparing our forecasts to actuals for metrics that are more sensitive to seasonality, such as number of orders and revenues, is not indicative of the true performance of the model. That being said, even for these highly seasonal measures our forecasts were within 5-7% of the actual results, which is pretty good considering we didn’t have seasonal variables in our model.
When we re-ran our model on the additional data points Farfetch has disclosed since Q3 2018, we saw very little change of model parameters. This suggests that the company has performed pretty much in line with our expectations in terms of the underlying customer behavior. So what did change?
2. Margins
In short, Farfetch margins took a big hit after its IPO, especially in Q2 2019. Three line items have changed materially: gross margin (GM) went down, share-based compensation (SBC) went up, and General & Administrative expense (G&A) went down (but not enough to offset the former two sources of margin weakness).
Gross margin. When we analyzed Farfetch’s F-1, its TTM GM was 51.4% and relatively stable. Since then, it has plummeted to 46.4% on a TTM basis and to 40.7% in Q2 2019 alone. This was a huge drop.
To visualize the relative stability that Farfetch had enjoyed up to and including their IPO, consider this plot of their TTM gross margin over time:

Over the previous three years, their gross margin was relatively stable at around 51%. It was for this reason that we had forecasted their GM would remain at approximately 51% in the future. Given the information that we had at the time, we believe this expectation was a reasonable one. However, while the chart above hints at issues in Q2 2019, it does not do justice to the magnitude of those issues. When we plot Farfetch’s gross margin over all quarters for which quarterly data is available, the magnitude of the drop is much more apparent:

Make no mistake, Q2 2019 was atrocious from a gross margin standpoint. But is this weakness due to transitory factors or more persistent ones?
The company mentions three reasons for this weakness: (1) big promotions, (2) a lower third-party take rate, and (3) inventory write-offs. Promotions were the biggest driver of the gross margin drop – in order to gain market share and stay price competitive, the company decided to actively promote during the latter half of Q2 2019. On the earnings call, Farfetch CFO Elliot Jordan said that they the company is going to scale back the promotional activity by managing its P&L growth: “In assessing the short-term outlook and setting growth targets for Q3 and Q4 [2019], we have decided to focus on: delivering solid but not overly aggressive market share gains, remaining competitive but stepping back from excessive use of promotions”. This indicates that in the short run we can expect some upward reversal of gross margins, the question being how much they are willing to accept and at what cost to their topline growth.
So where do we go from here? Management noted on their earnings call that we should expect the overall environment to remain promotional for “the next two to four quarters” before returning to normalcy. We handicap this further, assuming in our model that the company’s gross margin will stay at its current level for the next two years and then slowly revert back to its pre-Q2 2019 level of 50% over the next three years. We believe that this is a conservative yet reasonable view of the evolution of Farfetch’s margin profile, and could easily sensitize this assumption as more information comes in or other scenarios are desired.
Share-based compensation. Another line item that has significantly changed from the pre-IPO analysis was Share-based compensation (SBC). In one year, it went from a reasonable 5.3% of revenues to a whopping 17.7% of revenues TTM.

The company notes this was primarily due to three reasons: (1) higher fair value per share driven by the post-IPO share price and updated valuation assumptions, (2) additional key-contributor grants, (3) award of acquisition-related long-term employee incentives. We expect that, in the long run, SBC as a % of revenues will slowly go down from current levels because (1) in essence, this expense is akin to a fixed cost – CFO Elliot Jordan even mentions an “ongoing quarterly $40M charge” when discussing it on the earnings call, and (2) the company cannot continue granting options at this pace and will have to scale it back.
G&A. G&A expense has decreased from 43.2% to 34.7% of revenues since our analysis – as expected, the company is driving operational leverage from the fixed cost base. This improvement partially offset the significant margin drop due to gross margin deterioration and SBC growth.
The other expense line items were of lesser significance:
Other expenses. Other expenses and FCF components have largely remained at similar levels.
- Demand generation expense went up from 16.9% to 17.1% of revenue.
- Technology expense was unchanged at 10.7% of revenue.
- D&A was slightly up from 3.4% to 5.9% in part due to amortization of acquired intangibles.
- Capex went up from 3.9% to 5.6%. This appears to be due to a capex bump in Q2 2019 with not much explanation from the company. We expect the company will bring capex back to lower levels in the long run as their business model does not require significant capital.
3. WACC
At the time of our pre-IPO analysis we estimated company’s WACC at 10%, in line with its marketplace peers. Due to the stock price volatility, its cost of capital as measured statistically spiked to 25%+, then went down and, according to Bloomberg, sits at 14.8% today. Although we expect Farfetch’s WACC to revert back down to the level of its peers as it matures, it will likely remain at higher levels in short and mid-term and its valuation is very sensitive to WACC given its sensitivity to longer-term cash flow performance.
4. Valuation update and sensitivity analysis
Based on the observations above and assuming that (1) company’s gross margin will stay at present levels for the next two years and then go back to 50% over the next three years, (2) SBC gradually declines to ~5% of revenues in line with its peers over the next 10 years, and (3) Farfetch continues to drive operational leverage, our updated Farfetch fair valuation estimate is $14 per share at a 10% long-term WACC.
However, we would like to reiterate that this valuation is highly sensitive to margin and WACC assumptions and as such, valuation uncertainty remains very high. We expect the stock price to remain volatile for these reasons.
For example, our valuation model suggests that 1 percentage point of long-term EBIT margin target is worth about $2.50 per share, while 1 percentage point of WACC is worth about $2.70 per share. As such, for example, if Farfetch’s WACC is actually 12%, that would put their fair valuation below $10 per share. Of course, uncertainty cuts both ways – if the margin weakness evidence in Q2 2019 does end up being completely transitory in nature, we would end up with a valuation closer to the original $20 we had forecasted earlier.
To make it easy for you to perform this sort of sensitivity analysis, and part of our broader goal of making our CBCV methodology more accessible and usable, we’re excited to share with you an early version of the CBCV Valuation Simulator. The CBCV simulator is an app that allows you to quickly and easily see how the fair valuation changes as a function of key customer behavior and financial inputs. To access it on a mobile device, click here. For a desktop-optimized version, click here. Play with it and let us know what you think!

Addendum: A cautionary comment: Farfetch is removing disclosures…
We were greatly disappointed to learn that Farfetch decided to stop reporting the Number of Orders metric beginning in Q1 2019. The company stated that it no longer believes “Number of Orders” on the Farfetch Marketplace provides a meaningful view of business performance. This is especially ironic because in the very same filing, it referred to this metric as one of key drivers of GMV, revenue, cost of sales, etc. At a time when many companies are moving towards disclosing more insightful customer-related metrics (for example, the number of orders or sales by cohort – what we call a C3, or a Customer Cohort Chart), it’s a pity that Farfetch has decided to move in the opposite direction. Number of orders is one of the key customer-related metrics that enables investors to use Customer-Based Corporate Valuation methodology for more accurate company valuation. It is hard not to wonder whether this decision was strategic. Executives at Farfetch: we would encourage you to resume your reporting of the metrics contained in your F-1 filing.
August 23, 2019
Daniel McCarthy and Peter Fader are co-founders and Val Rastorguev is a Director at Theta Equity Partners, a company specialized in Customer-Based Corporate Valuation services — valuing firms by forecasting what their current and future customers will likely do.
This article is for informational and educational purposes only, you should not construe any such information or other material as investment, financial, or other advice. Nothing contained in this article constitutes a solicitation, recommendation, endorsement, or offer by Theta Equity Partners to buy or sell any securities or other financial instruments.