How to undervalue your business by 50% in one easy step
In his recent blog post and article, renowned corporate finance and valuation expert Aswath Damodaran discussed “user-based valuation,” which is virtually the same, philosophically, as what we call “customer-based corporate valuation” (CBCV). CBCV is a methodology for valuing companies by predicting the underlying behavior of their customers, which we have been perfecting in our academic work (for subscription and non-subscription businesses) as well as through our firm, Theta Equity Partners.
Damodaran does an excellent job deconstructing companies’ financials and applying user-based valuation principles to estimate the value of Uber riders, and of Amazon Prime, Netflix and Spotify customers. He is way ahead of the curve when it comes to analyzing company valuations by better understanding what is going on at the customer level. But if you look closely at these valuation models (and virtually every other company valuation model analyzing user-based businesses), you will notice that they all make one very important assumption — a constant churn rate. They all assume there is one “average” churn rate which is shared by all customers and does not change over time when, in fact, churn rates almost always vary across customers and over time.
To his credit, Damodaran acknowledges this, discussing “user diversity” and the challenges of addressing it due to lack of information (more on this important point at the end of this post). However, this is a lot more than an academic detail — in this post, we will show that ignoring the heterogeneity in churn rates across customers significantly underestimates the value of a company — sometimes by a whopping 50% or more.
If you are on the buy-side looking to invest in a company, you may often be undervaluing it, missing opportunities. If you are on the sell-side looking to exit a company or raise capital, you will be selling yourself short and leaving money on the table if you ignore customer heterogeneity. This is especially important because some companies have very low heterogeneity while other companies have very high heterogeneity, leading to large fluctuations in fair valuation for firms that may look identical in terms of their “average” churn rates. In today’s high-valuation environment, being able to identify companies selling for high valuations that actually deserve those valuations will lower your portfolio’s risk substantially.
Case study: Vodafone Italia
A very simple yet powerful example of this is Vodafone Italia. We have explained this example many times in the classroom as well as in a book that one of us wrote, “Customer Centricity,” discussing the importance of embracing customer heterogeneity as well as its managerial implications. Even though this example is based on a subscription-based company, the underlying principle is valid for non-subscription companies as well.
Vodafone Italia is one of the few companies that was smart enough to realize that not all its customers will renew their subscriptions with the same frequency. Some are more likely to renew, and others are significantly less likely to renew. As a result, the company didn’t just look at the average renewal rate of all its customers; instead, it broke those customers down into three customer segments, each grouped by their propensity to renew (or, equivalently, to churn).
Let’s see how this seemingly small adjustment can significantly impact the value of customers and the overall corporate valuation. In one of their previous presentations, they reported three customer segments with different attrition rates — High risk with a 65% churn rate (10% of the customer base), Medium risk with 35% churn (20% of the customer base), and Low risk with a 6% annual churn rate (70% of the customer base):


Source: “Vodafone achievements and challenges in Italy” presentation (September 12, 2003)
If you do what everyone else is doing and calculate the average churn rate across the customer base, you will get a 17.7% annual rate (6% x 0.7 + 35% x 0.2 + 65% x 0.1 = 17.7%). A churn rate of 17.7% will give you an average customer lifetime of 5.6 years (1 / 0.177 = 5.6 years). These are the numbers you will see in most reports, filings, and valuation models.
Now let’s do it the right way — explicitly taking customer heterogeneity into account. For each of three segments, let’s calculate its average customer lifetime (1 / churn):
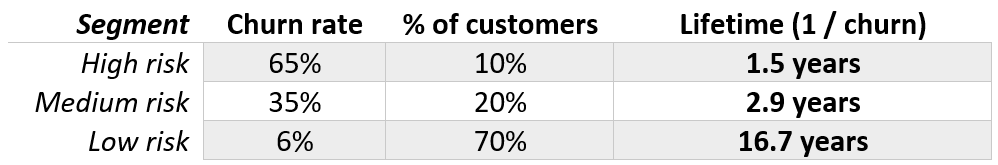
This will give you a 12.4-year average lifetime across all customers (16.7 x 0.7 + 2.9 x 0.2 + 1.5 x 0.1 = 12.4 years) — more than double the lifetime in the single churn rate case.
In other words, you will be underestimating the longevity of your customer base by more than 50% by using a single average churn rate! Just let that fact sink in.
In fact, the undervaluation is even more severe when you account for fixed costs and financial leverage to translate customer value into overall corporate value — the more fixed costs and net debt a firm has, the larger the undervaluation becomes. Moreover, within each of those three segments at Vodafone, it is highly unlikely that all customers share exactly the same churn rate — if instead of three segments you knew the entire distribution of churn rates across all customers, you would get a different, even higher valuation of the customer base.
What to do about the data?
To be fair, as Damodaran correctly points out, data limitations may not allow us to account for differences in churn rates across customers. Companies are not required to disclose any customer-related metrics at all, so we often don’t even have a single retention rate in company filings, let alone enough data to capture customer heterogeneity with any statistical significance. If we have no customer-related data, then Damodaran is absolutely correct that there is not enough information to get an estimate of customer retention heterogeneity that we could trust. Perhaps this should be handled as a regulatory issue. But while we wait for the Securities and Exchange Commission (SEC) to put stricter rules in place for the disclosure of customer-related data, however, there are some ways to overcome these challenges today. Here are a few:
1. Using internal data. If you are a private equity or a venture capital firm doing an investment due diligence or planning to exit a portfolio investment, you will have access to company’s internal transaction logs. Transaction-level data regarding which customers renewed their subscriptions (or bought products), how much they spent, and when they spent it, allows you to build very accurate customer behavior models that account for heterogeneity accurately, allowing you to avoid the costly mistake of undervaluing a company. If you are acquiring a business, you want to know the true value of your investment (although you will want to keep quiet about it). If you are selling it, you want to have a data-based valuation demonstrating the full potential of your company.
2. Using company’s filings in a smart way. When internal data is not available (for example, if you are a hedge fund or any other outside investor), sometimes you may still be able to uncover churn heterogeneity by leveraging customer data contained in SEC filings. As our experience shows, even if a subscription firm periodically discloses a single average churn rate (or, equivalently, total customers acquired) each period in conjunction with the total size of their customer base, analysts would have just enough information to infer the distribution of churn rates across customers and, therefore, a more accurate valuation estimate for the firm. In the case of Blue Apron, for example, their S-1 filing disclosed the total number of acquired customers during a 3-year period (and only by dividing the total marketing expense by their reported customer acquisition cost), the number of quarterly active customers over time, and a couple of disclosures regarding their cumulative spend over time. This data was just enough for us to use our statistical models for customer behavior to infer Blue Apron’s retention curve. Unfortunately, not all companies disclose these metrics, but we believe that as more of them realize that disclosing customer metrics may actually help them communicate their value to shareholders, they will do so more regularly.
3. Using 3rd party data providers. Companies such as Second Measure use credit card panel data to keep track of customer spending and can generate retention curves for many businesses, such as Netflix, Uber, Blue Apron, and many others. These curves, together with customer-based corporate valuation probability models, allow analysts to estimate churn heterogeneity and arrive at more accurate valuations, even if companies don’t disclose any customer metrics at all.
Wrapping up
In sum, whether you are on the buy-side or sell-side, using a single customer churn rate may significantly underestimate the value of a company. Even when you allow for just two or three customer segments with different churn rates will significantly outperform a model that only allows for one, but the more granular you go, the more accurate a valuation you will get. If you have access to a company’s internal data, great — you can use it to derive a very reliable distribution for churn rates across customers. If you only have company’s SEC filings, then with just enough data and some smart analytics you may be able to do it, too. It might not be easy, but given the sensitivity of company valuations to these factors, it is very important.
We are in the middle of a sea change when it comes to the valuation of user-based businesses. Thought leaders like Aswath Damodaran, Andrew Chen, and Tren Griffin are discussing these issues more than ever before. It is only a matter of time before thoughtful treatment of customer retention becomes a regular part of the valuation exercise. It is high time to get on board, or risk getting left behind.
#CustomerBasedCorporateValuation #CBCV #churn
Val Rastorguev is a Director and Peter Fader and Daniel McCarthy are co-founders at Theta Equity Partners, a company specialized in customer-based corporate valuation — valuing firms by forecasting what their current and future customers will likely do. Theta Equity Partners serves PE and VC firms as well as corporations and hedge funds, helping them more accurately assess company value and gain deeper insights into unit economics.